




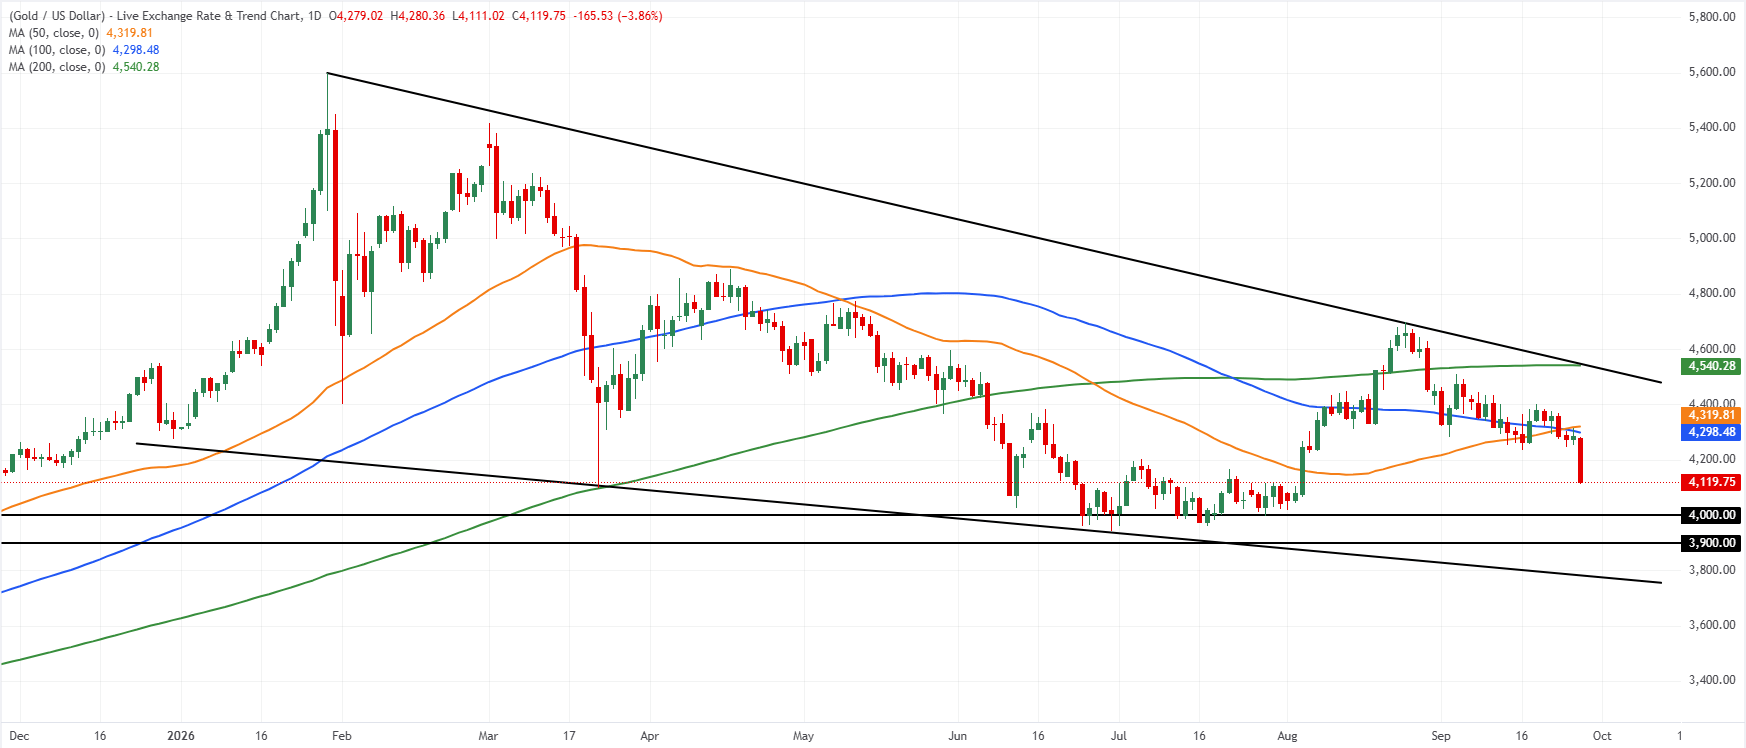
What is XAUUSD and How Does the Gold Live Chart Work?
XAUUSD is the financial ticker symbol representing the trading pair of gold against the US Dollar. The abbreviation "XAU" is derived from "X," the international prefix for precious metals, combined with "AU," the chemical symbol for gold on the periodic table (Aurum). When trading this pair, you are analyzing how many United States Dollars (USD) are required to purchase one troy ounce of gold.
The gold live chart displays real-time price fluctuations driven by global supply and demand. Financial institutions, central banks, hedge funds, and retail traders constantly submit buy and sell orders into a highly decentralized market. These transactions stream directly through liquidity providers, updating the bid and ask prices on your platform in fractions of a second. By tracking these ticks, the chart paints a visual representation of market sentiment, letting you execute trades with precision.
Pro Tip: Because gold is priced globally in US Dollars, any significant movement in the value of the greenback will immediately cause an inverse price adjustment on your live XAUUSD chart.
Key Differences Between Trading XAUUSD Spot Gold and Gold Futures
While both spot gold and gold futures allow you to speculate on price movements, they operate under fundamentally different structures. Understanding these structural boundaries is crucial to managing risk and selecting the right vehicle for your capital.
- Market Centralization: Spot gold (XAUUSD) is traded over-the-counter (OTC) in a decentralized market, whereas gold futures are traded on centralized exchanges like the COMEX.
- Contract Expiration: Spot gold has no contract expiration date, allowing you to hold positions indefinitely. Futures contracts, however, have fixed expiration dates, requiring you to roll over or settle positions periodically.
- Leverage and Margins: Spot trading typically offers higher retail leverage and lower minimum deposit requirements, making it highly accessible to independent retail traders.
Understanding XAUUSD Contract Sizes, Pips, and Lot Calculations
Accurate mathematical mapping is essential for surviving the volatile swings of the gold market. In spot gold trading, contract sizing is standard across most major platforms, but you must know how to translate lots into real dollar risk.
A standard contract (1.0 lot) of XAUUSD represents 100 troy ounces of gold. A mini lot (0.10 lot) represents 10 troy ounces, and a micro lot (0.01 lot) represents 1 troy ounce. In terms of market movement:
- A $0.10 (10 cent) price movement on the gold chart is equivalent to 1 point or pipette.
- A $1.00 price change (e.g., gold rising from $2,030.00 to $2,031.00) equals 10 pips (or 100 points).
- On a standard lot (1.0), a $1.00 price movement yields a profit or loss of $100. On a micro lot (0.01), that same $1.00 movement is worth exactly $1.00.
Best Time Frames for Analyzing the XAU to USD Live Chart
Your trading style dictates which timeframes on the XAU to USD live chart warrant the most attention. Scalpers, day traders, and swing traders all read the same live data, but they filter it through vastly different windows of time.
For swing traders, the Daily and 4-hour (H4) charts are ideal for mapping macro trends and major liquidity zones. If your goal is day trading or intraday scalping, you should determine the dominant trend on the H1 chart, then drill down to the 15-minute (M15), 5-minute (M5), or 1-minute (M1) charts to pinpoint your entry. Utilizing customized technical indicators can dramatically simplify this multi-timeframe analysis by highlighting key crossovers and price levels automatically.
How to Read the XAUUSD Live Chart for High-Probability Setups
Reading a live chart is not about predicting the future; it is about recognizing asymmetric risk reward profiles. A high-probability setup occurs when multiple analytical technical filters align in the exact same zone—this is known as confluence.
To spot these setups, look for areas where a horizontal key level matches up with a dynamic moving average, a Fibonacci retracement level (such as the 61.8% or 78.6% Golden Pocket), or an active volume profile shelf. When price approaches this cluster, wait for a rejection candlestick signal, such as a pin bar, engulfing candle, or Morning Star pattern, to validate that buyers or sellers are stepping in before clicking execute.
Key Support and Resistance Levels on the XAU to USD Live Chart
Support and resistance levels represent psychological thresholds where supply and demand historically fall out of balance. Because gold is a highly liquid and heavily institutional asset, these levels act as gravity wells for price action.
Identify support by looking for valley bottoms where price aggressively bounced upward, indicating aggressive institutional buying. Identify resistance by finding peak ceilings where aggressive selling drove prices back down. On the XAU to USD chart, watch psychological round numbers (such as $2,000, $2,050, or $2,100), as these coordinates attract massive volumes of pending buy and sell limit orders.
Using Moving Averages and RSI on the Real-Time XAUUSD Chart
Combining trend-following indicators with momentum oscillators is a classic approach to taming gold's daily volatility. The exponential moving average (EMA) and the Relative Strength Index (RSI) are highly effective tools when paired correctly.
A typical setup utilizes the 50-period EMA and the 200-period EMA on the 1-hour or 4-hour charts. When the 50 EMA is above the 200 EMA, you should lean heavily into buy setups. Simultaneously, monitor the RSI (configured to 14 periods). When the RSI drops below 30 (oversold) during a dominant uptrend, or rises above 70 (overbought) during a dominant downtrend, look closely for potential pullback reversals.
Key Technical Tip: Beware of overbought or oversold RSI readings during strong macroeconomic trends. Gold can remain highly overbought for weeks during geopolitical flight-to-safety runs.
Identifying Supply and Demand Zones on the Gold (XAUUSD) Chart
Supply and demand trading bypasses retail indicator clutter to focus on raw institutional order flow. These zones represent price ranges where major market makers left behind unfilled orders due to a lack of opposing liquidity.
To locate a strong supply zone, look for an aggressive downward expansion that leaves behind an imbalance of candles. The base structure or last up-candle right before that drop is your supply zone. Conversely, a strong demand zone is established by identifying an aggressive upward expansion; the base structure or last down-candle before that surge represents your demand zone.
Spotting Chart Patterns: Head & Shoulders, Double Tops, and Flags on Gold
Chart patterns are visual representations of transitioning market psychology. Because XAUUSD features high liquidity and participation, classic technical patterns print frequently and command significant attention from algorithmic systems.
Reversal patterns like the Head & Shoulders, Double Tops, and Double Bottoms warn of exhausted trends. A double top at a major daily resistance area signifies that buyers are failing to push price higher, paving the way for short positions. Continuation patterns, such as Bull Flags and Bear Flags, suggest that price is temporarily consolidating before resuming its primary direction, offering low-risk entries on breakouts.
Understanding XAUUSD Market Structure and Price Action Trends
Before applying any indicators, you must accurately read pure market structure. Price action on the XAUUSD chart moves in structural phases: uptrends, downtrends, and ranges.
An uptrend is characterized by a series of Higher Highs (HH) and Higher Lows (HL). A downtrend is defined by Lower Highs (LH) and Lower Lows (LL). When the market fails to produce new highs or lows and bounces repeatedly off the same horizontal planes, it is in a consolidation or ranging phase. Trading with the dominant structural trend ensures you are positioned on the path of least resistance.
How Liquidity Sweeps and Fair Value Gaps (FVG) Impact Gold Prices
Modern trading models heavily emphasize liquidity-based movements. Because smart money participants operate with immense volume, they must seek out dense pockets of opposing orders (liquidity) to fill their positions.
A liquidity sweep occurs when the price breaches an obvious previous high or low (where retail traders place buy/sell stop orders) only to immediately reverse course. This aggressive move triggers the retail stop-losses to match the institutional buy/sell interest. Additionally, explosive moves leave behind Fair Value Gaps (FVGs)—imbalances characterized by a three-candle sequence where there is no overlap between the first and third candles. The market has an inherent tendency to pull back and fill these gaps before resuming its underlying directional trend.
Analyzing Multi-Timeframe Trends on the XAU to USD Chart
Analyzing a single timeframe is a recipe for trading blind. To gain a true edge, you must execute a systematic, top-down multi-timeframe analysis.
Begin on the Weekly or Daily chart to identify the overarching directional trend. Next, move down to the 4-hour (H4) or 1-hour (H1) chart to find the key levels and immediate structure. Finally, use the 15-minute (M15) or 5-minute (M5) charts to wait for price to reach your higher-timeframe areas of interest, executing your trade once local confirmation signals appear. This approach keeps you aligned with institutional order flow.
Trading Order Blocks and Change of Character (CHoCH) on XAUUSD
Order Blocks and Change of Character (CHoCH) are pillars of Smart Money Concepts (SMC) that help identify institutional reversal points on the live gold chart.
An Order Block is a specific candle where institutional market makers heavily loaded their buy or sell positions. The last bearish candle before a strong bullish impulse is a bullish order block, which acts as a major support zone when revisited. A Change of Character (CHoCH) occurs when the local market structure breaks its pattern of HLs or LHs. For instance, when an asset is in a downtrend and breaks above its last Lower High, a bullish CHoCH is printed, signalling a structural shift.
Top XAUUSD Day Trading Strategies for Live Chart Volatility
Gold is famous for its daily intraday volatility, presenting massive opportunities for day traders. Successful day trading requires mechanical rules and consistent execution.
Popular strategies include the London session breakout strategy, where traders draw a box around the Asian consolidation range and trade the ensuing breakout when London opens. Another approach is pullback trading within supply and demand zones, targeting liquidity sweeps of yesterday's highs or lows. Intraday traders who prefer automated rules can utilize custom Forex expert advisors (EAs) to execute trades systematically based on these precise rules.
How London and New York Session Openings Move the XAUUSD Chart
The XAUUSD chart does not move uniformly throughout the day. Volatility is highly dependent on when the major financial hubs of the world open their trading desks.
The Asian session is typically quiet, consolidating in a narrow range. Volatility picks up significantly at the London open (08:00 GMT), as major European institutions place their orders. However, the peak trading volume for gold occurs during the London/New York overlap (13:00 GMT to 17:00 GMT), when both markets are fully open. This overlap is when major economic releases occur, creating rapid price action and wide-range daily candles.
Managing Risk and Spread Costs During Live XAU to USD Trading
Gold trading offers huge rewards, but its high volatility can quickly wipe out undercapitalized accounts if strict risk controls are neglected.
Always calculate your position size before entering a trade, keeping your total risk per trade between 1% to 2% of your account balance. Furthermore, be mindful of broker spreads. During high-impact news events or the daily market rollover (when liquidity temporarily dries up), spreads can widen dramatically, which can prematurely trigger stop-losses. Many modern retail traders choose to leverage proven copy trading networks to automatically copy the risk-controlled entries and exits of professional gold traders.
How CPI Data and Fed Rate Decisions Impact the Live XAUUSD Chart
Fundamental factors act as the ultimate catalyst for sustained price trends. Among these, the Consumer Price Index (CPI) and Federal Reserve interest rate decisions are the most critical.
If CPI reports show inflation is running hotter than expected, the Federal Reserve will likely raise interest rates to cool the economy. Higher interest rates make yield-bearing assets like government bonds more attractive, reducing demand for non-yielding gold and causing XAUUSD to fall. Conversely, if the Fed hints at lowering interest rates or slowing down quantitative tightening, gold typically rallies aggressively.
The Relationship Between the US Dollar Index (DXY) and XAU to USD Chart
Because gold is traded against the US Dollar on the spot market, the strength of the dollar is a direct driver of gold's value. The US Dollar Index (DXY) is the primary benchmark measuring the performance of the USD against a basket of major foreign currencies.
Historically, XAUUSD shares a strong inverse correlation with the DXY. When the DXY is in a strong uptrend, gold prices usually struggle or trend lower. When the US Dollar weakens, gold becomes cheaper for buyers using foreign currencies, pushing gold prices higher. Professional traders routinely keep a live DXY chart open alongside their XAUUSD chart to spot leading signals.
How Inflation and Geopolitical Tensions Drive Gold Price Breakouts
For thousands of years, gold has served as the ultimate store of value. Unlike fiat currencies, central banks cannot print more physical gold, making it a natural hedge against purchasing power loss.
During periods of hyperinflation or elevated geopolitical conflict (such as wars, trade blockades, or global supply chain breakdowns), investors rapidly exit riskier assets like equities and seek safety in gold. This flight-to-safety creates explosive breakouts on the XAU to USD live chart, with traditional technical resistance levels frequently getting cleared with ease as capital flows globally into safe-haven assets.
Step-by-Step: Setting Up Your XAUUSD Live Chart on MT4, MT5, or TradingView
Having a clean, optimized chart layout is essential for fast decision-making and precise execution. Here is how to configure your workspace across the top three trading platforms:
- Select the Pair: Search and add "XAUUSD" or "GOLD" to your active Watchlist.
- Optimize Chart Colors: Remove heavy gridlines. Change candle bodies to clean green (bullish) and red (bearish) colors to reduce visual fatigue.
- Apply Essential Indicators: Add a 50 EMA, a 200 EMA, and an RSI indicator. (Optional: Add a session breaks tool to clearly isolate the NY and London opens).
- Save Your Template: Right-click the chart background, select "Template," and save your layout as a custom template (e.g., "Gold Live Intraday") so you can instantly load it on any instrument.