We automate popular YouTube trading strategies exactly as described. Download the original EAs for free to backtest them yourself, and explore our optimized versions designed to actually become profitable.
EAs coded & tested
YouTube claims average
Tested reality average
Source code available
We code and audit a new YouTube strategy every Tuesday. Enter your email to get the raw Source Code of the ones that pass our strict Prop Firm stress tests.
Last updated October 2026 · 41 strategies tested
YouTube is full of trading strategies and Expert Advisors (EAs) claiming impressive win rates and profitable results. But how do these strategies actually perform when they are coded, tested, and evaluated using historical market data?
At FXSnipers, we take popular YouTube trading strategies and turn them into working MetaTrader EAs for MT4 and MT5 based on the strategy described by the original creator. We then backtest the original implementation to compare the claimed performance with actual results.
Our testing goes beyond win rate. We evaluate factors such as profitability, drawdown, trade frequency, risk management, and overall consistency. When an original strategy has potential but needs improvement, we also develop optimized versions with refined trading logic, execution, and risk controls.
The goal is simple: provide a transparent way to compare YouTube trading claims with tested EA performance without promising guaranteed profits. Selected original EAs are available for free so you can download, backtest, and evaluate them yourself.
EA implementation based on the strategy presented by the original creator.
Historical testing to measure performance under defined market conditions.
Compare the win rate claimed by the source with the results produced during testing.
Evaluate drawdown, risk exposure, and consistency rather than only wins.
Explore refined versions with improved risk controls and trading logic.
Download selected original EAs and conduct your own testing.
Important Disclaimer: Backtested results are historical and do not guarantee future trading performance. Results can vary depending on broker, spread, execution, market conditions, and testing parameters.
 Riley Coleman
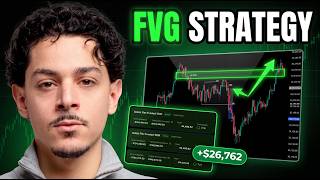
Strategy OverviewThis strategy is built upon finding key horizontal support and resistance areas using high timeframe (15-Minute) charts and executing mean-reversion trades on the 1-Minute chart. It focuses on identifying institutional overextensions (unhealthy moves) via Fair Value Gaps (FVG) and looking for localized structure rejections to time highly favorable 1:3 Risk-to-Reward trades.Core Strategy StepsHTF Location Analysis: Establish macro boundaries by finding the local extremes on a 15-minute timeframe.Unhealthy Move Tracking: Look for displacement via a Fair Value Gap (FVG) highlighting institutional liquidity spikes.Reversal Execution: Enter on a breakout of the immediate structural swing low or swing high after interacting with HTF limits.Strict Risk Management: Establish static risk to rewards ratios (minimum 1:3) or use the trailing stop configuration of consecutive bars to lock in dynamic gains.
 Day Trading Addict
Strategy OverviewThis strategy is optimized specifically for small trading accounts ($500 and under or micro prop firm accounts) to avoid over-leveraging and aggressive drawdowns. Rather than relying solely on standard trend following, it categorizes market conditions into four key states: Trending, Ranging, Reversals, and Breakouts.Core Execution RulesSupport & Resistance Identification: Tracks local high and low levels over a set lookback window.Proximity Test: Waits for price action to touch or come within a fraction of an ATR of defined support or resistance zones.Confirmation Trigger: For long setups, price must break and close above the high of the rejection candle at support. For short setups, price must break and close below the low of the rejection candle at resistance.Risk Management: Fixed 1:2 Risk-to-Reward ratio with stop losses dynamically placed just past the swing rejection extreme. Dynamic sizing limits loss to a predefined risk percentage (e.g. 1% per trade).
 Neeraj Joshi
Strategy OverviewThis strategy targets high-probability market liquidity sweeps occurring around the opening of the New York session. By establishing a key 2-hour benchmark range between 17:30 and 19:30 IST (typically 12:00 to 14:00 UTC), it monitors for liquidity sweeps in a lower 5-minute timeframe, executing reversals when the price pulls back inside the range boundaries.Core Components & Trade RulesReference Range: Track the highest high and lowest low of the 2-hour candle sequence (5:30 PM to 7:30 PM IST).Entry Logic (Short): Triggered when a 5-minute candle closes above the session high (sweep), followed immediately by a candle closing back inside the boundary.Entry Logic (Long): Triggered when a 5-minute candle closes below the session low (sweep), followed immediately by a candle closing back inside the boundary.Risk Management: Stop Loss is placed slightly beyond the maximum extension of the sweep candle. Take Profit targets a robust 1:2 risk-to-reward ratio.
 Lewis Kelly
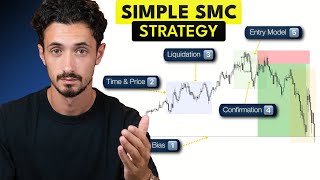
SMC Engine Trading Strategy OverviewThis systematic Smart Money Concepts (SMC) strategy, optimized by Lewis Kelly over four years of live execution, functions as an intraday bias model. By standardizing market sweeps and institutional ranges, it eliminates subjective execution errors.Core Rules and ParametersRule 1: Directional Bias: Defined by higher-timeframe structural swing ranges (15m structures). The bias remains unchanged until a structural Change of Character (CHoCH) occurs.Rule 2: Time and Price: High-volume liquidity windows define execution: London Session (2:00 AM - 5:00 AM EST) and New York Session (7:00 AM - 10:00 AM EST).Rule 3: Liquidation Sweep: Trades are only authorized once the high or low of the defined Asian Range (20:00 - 02:00 EST) is purged during the trade windows.Rule 4: Reversal Confirmation: A lower timeframe execution shift (CHoCH) is required on the 1m/5m timeframe to prove institutional order-flow reversal before entry.Rule 5: Entry Trigger: Entry is filled using Fair Value Gaps (FVGs), Inverted FVGs, or Mitigation blocks inside the shifted leg.Risk ManagementStop Loss levels are placed strictly beyond the structural high/low of the sweeping candles. Targets are set with a highly favorable risk-to-reward projection targeting a 1:6.23 Ratio.
 TJR
TJR
Strategy OverviewThis strategy represents TJR's updated institutional execution model designed for Day Trading index markets (S&P 500, NASDAQ) and currency pairs. It focuses heavily on higher-timeframe draws on liquidity (specifically Session Highs/Lows established during London) and utilizes ICT-based structural sweeps, Market Structure Shifts (MSS), and dynamic confirmations on lower timeframes (5-Minute / 1-Minute).Key Parameters & Indicators:London Session (02:00 - 08:00): Establishes the core daily high and low session anchors representing key pockets of resting sell-stop and buy-stop liquidity.NY Session Execution Window (09:30 - 16:00): The core operational phase where liquidity sweeps are monitored and parsed.Market Structure Shift (MSS): A swing level structural breakdown confirming that the manipulation phase is complete, shifting distribution direction.Equilibrium / Fair Value Gap (FVG): Confluence areas used to structure pending limit entries within the displacement leg.Risk to Reward Ratio: Structured strictly at 1:1.33 to maintain long-term statistical dominance.Execution Methodology:Manipulation: S&P/NASDAQ rises above the London session high (sweeping buy stops) or drops below the London session low (sweeping sell stops).Shift Confirmation: A clear, impulsive candle breaks structure (MSS) on the 5-Minute timeframe.Retracement & Entry: Limit entry is structured directly at the displacement leg's Equilibrium (50% level) or dynamic FVG zones.Strict Risk Mitigation: Stops are dynamically positioned right above the local swing high/low of the sweep with a 1.33x take profit offset.
 PB Blake
Strategy OverviewThis strategy updates classic ICT Smart Money Concepts (SMC) principles by combining Higher Timeframe Trend Bias (DOL) with Inversion Fair Value Gaps (IFVG), Changes in State of Delivery (CISD), and Rejection Blocks. Rather than entering standard retracements directly, this approach acts defensively by waiting for a manipulation leg to tap key levels before confirming order flow redirection via an inverted FVG on lower execution timeframes.Key System SettingsHTF Trend Filter: Uses 200 EMA of HTF (Daily, 4H, 1H or 15M) to establish dominant daily direction.Key Level Identifiers: Rejection Blocks, Fair Value Gaps, or Changes in State of Delivery (CISD) define the trade zones.LTF Execution Filter: Enters strictly when a counter-trend FVG gets fully closed through (inverted) on the LTF.Dynamic Risk Management: Stop Loss is locked to the structural swing high/low of the manipulation leg with a 1:1.5 to 1:3 Take Profit targeting structural points of liquidity.
 The Trading Channel
This comprehensive multi-timeframe day trading strategy focuses on aligning entries with major market structure trends while timing entries off lower timeframe pullbacks.Key Strategy RulesHigher Timeframe (HTF) Market Structure: Identifies macro trend direction (e.g. 1-Hour chart) using major swing levels and HTF moving average filter to confirm higher highs/higher lows or lower highs/lower lows.Lower Timeframe (LTF) Execution: Trades on lower timeframes (e.g. 5-Minute chart) in the direction of the HTF major trend.Pullback Entry Trigger: Wait for price to pull back to/beyond the 20 LTF EMA without breaking the major structure level, followed by a momentum candle close back in the direction of the HTF trend.Stop Loss Placement: Placed just beyond the recent major/minor swing low for buys or swing high for sells.Take Profit Target: Fixed 2.4:1 Reward-to-Risk Ratio based on trade stop loss distance.
 Pushkar Raj Thakur: Stock Market Educator 📈
Strategy OverviewThis strategy explores three forms of arbitrage in crypto derivatives trading across multiple exchanges (such as Delta Exchange, Shark Exchange, and CoinSwitch) via multi-exchange unified trading terminals like MirrorPip:Spot/Futures Price Arbitrage: Capturing temporarily wide price spreads between two exchanges by buying long on the cheaper exchange and shorting on the expensive exchange simultaneously.Funding Rate Arbitrage: Capitalizing on significant funding rate disparities (e.g., +0.1% to +0.4% per 8-hour or 3-hour period) by buying long where funding is paid/zero and shorting where funding payouts are extremely high, creating delta-neutral income.Implied Volatility (IV) & Expiration Arbitrage: Exploiting differences in option expiration times and implied volatility across exchanges by shorting option contracts with higher premium/earlier expiry and locking long legs on cheaper exchanges.Trade Rules & ParametersEntry Filters: Limit order execution to eliminate order slippage and ensure trading fee overhead (including taker/maker fees and taxes) does not exceed funding yield.Position Hedging: Simultaneously hold 1:1 opposing positions on two different exchanges to neutralize price market risk.Exit Rules: Unwind both long and short legs once funding rates equalize or options reach targeted time decay levels.
Strategy OverviewThe Results Session Breakout Strategy is designed to capture high-momentum directional moves triggered during corporate quarterly earnings releases. The core principle revolves around filtering out ordinary price fluctuations by requiring severe volume expansion and range expansion alongside a clear price action follow-through.Key System ComponentsVolume Spike Filter: Trigger candle must possess volume at least 2x greater than its 20-period Moving Average, confirming institutional participation.ATR Range Expansion: Candle range must exceed 1.5x ATR to signify genuine volatility expansion resulting from earnings announcements.Donchian Breakout: The closing price must breach the multi-day high or low level (10-period lookback) to guarantee directional follow-through.Entry RulesLong Entry: Bullish candle (Close > Open) accompanied by a Volume Spike (> 2x Avg) and Volatility Expansion (> 1.5x ATR), closing above the highest high of the previous N bars.Short Entry: Bearish candle (Close < Open) accompanied by a Volume Spike (> 2x Avg) and Volatility Expansion (> 1.5x ATR), closing below the lowest low of the previous N bars.Exit RulesStop Loss: Set dynamically using 1.5x ATR from the entry level.Take Profit: Set at 3.0x ATR to maintain a 1:2 Risk-to-Reward ratio.
Strategy OverviewThis XAUUSD (Gold) scalping strategy combines candlestick pattern identification (Pin Bars and Engulfing patterns) with baseline trend filtering using a 50 Exponential Moving Average (EMA). Dynamic risk management is handled via the Average True Range (ATR).Inputs & ConfigurationEMA Period: 50 period trend filter.ATR Period: 14 period dynamic volatility calculation.ATR SL Multiplier: 1.5x ATR for stop loss placement.Risk/Reward Ratio: 1:1.5 target allocation.Entry RulesLong Entry: Price closes above 50 EMA AND either a Bullish Pin Bar or Bullish Engulfing pattern completes.Short Entry: Price closes below 50 EMA AND either a Bearish Pin Bar or Bearish Engulfing pattern completes.Exit RulesStop Loss: Set at 1.5x ATR distance from the entry price.Take Profit: Set at 1.5x the risk distance (1:1.5 Risk-to-Reward ratio).
Strategy OverviewAmas PFT presents a high-probability prop firm focused trading methodology designed specifically to achieve consistent daily payouts ($1,000/day) by prioritizing base hits over home runs. The strategy is built around a strict 1:1 Risk-to-Reward ratio and relies on ICT Price Action principles including Higher Time Frame Draw on Liquidity, Candle Projection Theory (CPT), Fair Value Gaps (FVG), Inversion FVGs, and Displacement.Core Trading ModelsContinuation Model (Candle Projection Theory): Identifies strong higher time frame displacement candles closing aggressively toward buy-side or sell-side liquidity pools. Once displacement occurs and opposite FVGs are disrespected, the trader projects that the subsequent candle will expand in the same direction. Entries occur when price dips or rallies around the open price of the bar or retests lower time frame squeeze levels.Reversal Model (1-2-3 FVG Failure): Utilizes a 3-candle Fair Value Gap setup. When Candle 3 (C3) fails to close beyond Candle 2's high/low and instead closes inside C2's range, it signals seller/buyer exhaustion. Candle 4 (C4) is then projected to trade back into the gap to rebalance price.Risk & Execution RulesRisk-to-Reward: Strict 1:1 Target to Stop Loss.Target Size: Standard scalp target of 20 points on index futures (NQ/ES) or equivalent ATR multiples.Prop Firm Optimization: Focused on high win-rate consistency to clear combine targets and request frequent payouts without taking large drawdown risks.
Strategy OverviewThe Box Theory strategy strips away indicator clutter and focuses on institutional value areas derived from previous session highs and lows. Institutions accumulate inventory quietly inside these ranges, creating liquidity sweeps at extremes that trap retail momentum traders. By trading range boundaries using secondary confirmations like Slow Stochastic and Previous Session Close, traders align with smart money.Key InputsStochastic Length: 14 periods with 3 smoothing.Time Filter: Skips the first 15 minutes of the opening bell to avoid initial noise.Box Boundaries: Yesterday's High (Ceiling/Resistance) and Yesterday's Low (Floor/Support).Entry RulesLong Setup: Price tests the bottom of the box (support), closes above the previous session close, and Stochastic indicates oversold or bullish cross.Short Setup: Price tests the top of the box (resistance), closes below the previous session close, and Stochastic indicates overbought or bearish cross.Exit RulesTake Profit: Set at the 50% midpoint (midline) of the box.Stop Loss: Placed safely beyond the box extremes to avoid liquidity sweeps.
OverviewThe Ultimate Bitcoin Scalping Trading Strategy is designed for 5-minute timeframes, heavily leveraging the volatility and smooth price movements of crypto markets like Bitcoin. It integrates Exponential Moving Averages (EMA) with Support and Resistance zones to pin down sniper entries.Indicators UsedFast EMA: 9 Period (captures rapid momentum shifts)Slow EMA: 20 Period (tracks intermediate trend baseline)Support & Resistance: Demand and supply zones calculated from recent highs and lows.Entry RulesLong Entry: 9 EMA crosses above 20 EMA while price interacts with a recognized Support/Demand zone.Short Entry: 9 EMA crosses under 20 EMA while price interacts with a recognized Resistance/Supply zone.Exit RulesStop Loss: Placed just beyond the local swing high or swing low.Take Profit: Set at a minimum Risk-to-Reward ratio of 1:2 or 1:3, or secured dynamically using trailing stops.
Test Description
Strategy OverviewBrought by Sheldon on Crypto Banter, this leverage trading strategy focuses on a disciplined, six-pillar approach to generate steady daily returns (e.g., $100/day) using isolated leverage on exchanges like Bybit.Key PillarsPillar 1 - Checklist: Focuses on Risk-to-Reward ratio (>1:3), exact Stop-Loss and Take-Profit placements, buying red/selling green, and waiting for trend settling. Includes Fibonacci retracements, horizontal supports, trendlines, and oversold/overbought momentum.Pillar 2 - Position Sizing & Leverage: Uses Isolated Margin mode to protect account capital and leverage sizing relative to the setup and predefined risk limits.Pillar 3 - Cost Per Trade: Risk is strictly defined per trade (e.g. risking $33 to make $100) using calculated risk-to-reward ratios.Pillar 4 - Token Selection: Alternates between safety (Bitcoin) and aggression (major altcoins/gaming tokens) depending on portfolio trajectory and starting balance.Pillar 5 & 6 - Execution & Scaling: Systematic execution rules and compounding profits daily.
 JeaFx
JeaFx
Strategy OverviewThis strategy relies entirely on price action, market structure, and supply/demand zones without utilizing any technical indicators or macroeconomic fundamentals. By mapping market structure (Higher Highs/Higher Lows for uptrends, Lower Lows/Lower Highs for downtrends), the system identifies structural shifts and key supply/demand zones formed prior to momentum pushes.Core Trading RulesTrend Identification: Determine directional bias using high/low market structure. Uptrend = buy only; Downtrend = sell only.Zone Marking: Identify consolidation areas (the last candle prior to a strong pro-trend expansion impulse). Mark as Demand Zone in an uptrend, or Supply Zone in a downtrend.Trade Entry: Wait for price to pull back and retest the active Supply/Demand Zone in the direction of the dominant trend.Risk Management: Maintain a minimum 1:2.5 Risk-to-Reward ratio. Set stop loss beyond the supply/demand zone boundary and target the recent structural high/low.Confirmation Filter (Optional): Switch to lower timeframes (e.g., 2-minute) to await a secondary market structure change inside the HTF zone to increase win rate and tighten stop losses.
 TJR
TJR
Strategy OverviewThis strategy is designed specifically for scaling micro-accounts ($100 starting capital) using prop firm challenges. It emphasizes clean candle anatomy and high-probability momentum entries aligned with a higher-timeframe trend filter to maximize risk-to-reward metrics.Technical Setup & FiltersHigher Timeframe (HTF) Filter: 1-Hour (H1) Exponential Moving Average (50-period). Only take long trades if the HTF price is above the HTF EMA, and short trades if the HTF price is below the HTF EMA.Candle Momentum Identifier: Average True Range (ATR) on execution timeframe is used to measure candlestick body sizes. A high-momentum signal requires the body of the current execution bar to exceed 1.5x the standard ATR.Rules of EngagementLong EntryHTF Close is higher than HTF EMA(50).Execution bar forms a bullish candle with a body size larger than 1.5x ATR.Short EntryHTF Close is lower than HTF EMA(50).Execution bar forms a bearish candle with a body size larger than 1.5x ATR.ExitsStop Loss: Set slightly below the low (long) or above the high (short) of the entry candle using ATR buffering.Take Profit: Positioned at a fixed 1:2 Risk-to-Reward ratio to accommodate strict drawdown profiles of modern prop firms.
 Nifty Trading by Prabhat Sir
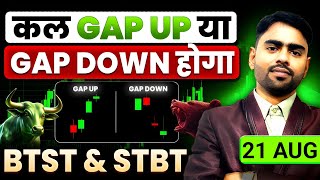
Strategy OverviewThis strategy captures overnight gaps in indices (such as NIFTY 50) based on momentum at the market close. Known as BTST (Buy Today, Sell Tomorrow) for bullish setups, and STBT (Sell Today, Buy Tomorrow) for bearish setups, it relies on directional momentum during the final minutes of the daily trading session to anticipate the following morning's opening gap.Key Features & RulesTrend Filter: Uses an Exponential Moving Average (EMA) to identify whether closing momentum is constructively bullish (price above EMA) or bearish (price below EMA).Timing: Trigger entries in the closing minutes of the market (default 15:15 / 3:15 PM) and liquidate exactly at market open the next day (default 09:15 AM).Geopolitical Context: The video emphasizes external factors like Trump's tweets, crude oil spikes, and international sentiment causing rapid opening gaps.Strict Risk Management: Limits overnight exposure to exactly 1 lot to control news-based risk which cannot be closed mid-session.
 The Trading Geek
Strategy OverviewThe A+ Market Mechanics Strategy is a high-probability Smart Money Concepts (SMC) framework developed by The Trading Geek. It relies on strict market structural hierarchy, filtering out low-probability trades by aligning internal market structure shifts with higher-timeframe swing directions within defined Discount and Premium price zones.Core Structural Rules & MechanicsHigher-Timeframe (HTF) Swing Structure: First, establish the dominant swing range by identifying valid Swing Highs and Swing Lows. A break above a major Swing High confirms a bullish trend; a break below a major Swing Low confirms a bearish trend.Premium / Discount Range: Calculate the 50% Equilibrium level of the active major swing range. High-probability long trades (A+ setups) are strictly taken in the Discount zone (< 50%). High-probability short trades are taken in the Premium zone (> 50%).Internal Change of Character (CHoCH): Wait for price to pull back deep into the discount/premium zone and mitigate a Point of Interest (POI) or sweep internal structural liquidity. Once internal structure shifts back in alignment with the higher-timeframe direction (Internal Market Shift / CHoCH), an entry trigger is generated.Risk-to-Reward Execution: Stop Losses are anchored structurally below the internal swing pivot with an ATR buffer. Trades target a minimum static Risk-to-Reward ratio of 1:2.5 or the opposing swing liquidity level.
 MambaFx
Strategy OverviewThis 1-minute scalping strategy leverages structural analysis on both the 5-Minute (HTF) and 1-Minute (LTF) timeframes to trade rapid breakouts in alignment with overall market momentum.Inputs & Configurations5M EMA Filter Length: Determines overall market trend bias on the 5-minute timeframe (Default: 50).1M Breakout Lookback: Lookback window on the 1-minute chart to construct support/resistance levels (Default: 10).Risk-to-Reward Ratio: Hard target structure (Default: 1:3).Entry RulesLong Trade (Buy): 5-Minute Close is above the 5-Minute EMA (Bullish Trend), and the current 1-Minute price breaks above the high of the last 10 1-Minute bars.Short Trade (Sell): 5-Minute Close is below the 5-Minute EMA (Bearish Trend), and the current 1-Minute price breaks below the low of the last 10 1-Minute bars.Exit RulesStop Loss: Set dynamically at the local support level (lowest low) for Longs, or localized resistance level (highest high) for Shorts.Take Profit: Standard fixed target calculated at a 1:3 or greater Risk-to-Reward ratio.
 JeaFx
JeaFx
Strategy ConceptThe core concept behind this strategy is avoiding premature trades on unconfirmed price action (intrabar fakeouts). Traders often take entries during a fast market push as price breaches a structural level, only to have the candle pull back, leave a wick (rejection), and trap them. This strategy strictly waits for confirmed candle closures beyond historical swing levels before generating trades.Setup & CriteriaSwing Highs & Lows: Evaluated over a configurable historical lookback period (default: 20 candles).Closure Rule: A long signal requires a candle body to close completely above the calculated swing high level. A short signal requires a candle body to close completely below the calculated swing low level.Time Frame Consistency: Analysis must be execution-timeframe specific. Rejections on lower timeframes are filtered out using the principal execution timeframe to confirm closures.Execution DetailsLong Entry: Triggered at the open of the next bar following a confirmed bullish closure beyond the swing high.Short Entry: Triggered at the open of the next bar following a confirmed bearish closure beyond the swing low.Risk Management: Stops are set dynamically outside the opposite swing zone or adjusted using an ATR buffer to manage noise. Profit targets are set on a strict Risk-to-Reward ratio (default: 1.5 or 2.0).
 Upsurge Club
Strategy OverviewThis masterclass video covers 10 intraday price action and technical trading concepts presented by SEBI registered analyst Priyank Sharma. The strategy codified here focuses on Concept #7: the 21 EMA Scalping Continuation Strategy.Core Trading RulesEMA Base: 21 Exponential Moving Average (EMA) on 5-minute chart.Crossover Trigger: Wait for price to cross and close on the outer side of the 21 EMA.Pullback Filter: Within the next 1 to 3 candles, price must stay on the breakout side of the 21 EMA and produce an opposite-colored candle (a red candle following a bullish cross, or a green candle following a bearish cross).Entry Rule: Place an entry stop order above the high of the pullback candle for longs, or below the low of the pullback candle for shorts.Stop Loss: Low of the pullback candle (or swing low) for longs, and high of the pullback candle (or swing high) for shorts.Take Profit: Fixed Risk-to-Reward ratio of 1:1.5 minimum.
 Data Trader
The SLC (Structure, Level, Confirmation) FrameworkThis strategy offers a systematic approach designed to stop retail traders from taking random, low-probability setups. It focuses entirely on trading in alignment with three steps: Structure, Level, and Confirmation.Strategy Mechanics:Structure: Established on the 4-Hour higher timeframe chart using Trend Filter Indicators (EMA 50 & 200). If EMA 50 is above EMA 200, only buy trades are considered. If EMA 50 is below EMA 200, only short setups are allowed.Level: Refined on the 5-Minute execution timeframe. Supply & Demand levels are determined by identifying structural bases from which major bearish or bullish expansion candles originated.Confirmation: Triggered once price taps into the established zones. Entries are confirmed when the Stochastic Oscillator crosses above the oversold boundary (for longs) or below the overbought boundary (for shorts).Exit Strategy: Stop loss is placed slightly past the structure level, with target take profit established at a clean 1:2 Risk-to-Reward ratio.
 Data Trader
Strategy OverviewThe SLC (Structure, Level, Confirmation) framework is designed to filter high-probability setups from low-probability noise. The system is engineered to trade strictly with the path of least resistance by aligning Higher Timeframe (HTF) context with Lower Timeframe (LTF) execution blocks.Core StepsS - Structure: Identify general market trend on 4-Hour timeframe. Upward movements (Higher Highs & Higher Lows) allow only Long positions. Downward movements (Lower Highs & Lower Lows) allow only Short positions.L - Level: Mark Supply & Demand levels on 5-Minute timeframe. Focus on candle blocks where aggressive market expansions initiated.C - Confirmation: Check Stochastic Oscillator behavior when price taps into the active Level. Ensure dynamic crossovers beyond threshold boundaries before initiating entry orders.Risk ManagementStrict structural placement. Stop Loss is positioned slightly above the local Supply Level (for Shorts) or below the Demand Level (for Longs). The Take Profit target is set symmetrically based on a 1:2 Risk-to-Reward (R) profile.
 The Rumers
ARC Method Strategy OverviewThe ARC (Area Range Candle) strategy is an institutional mean-reversion and range-trading framework designed to systematically capitalize on key price levels established by market makers and institutional orders.Key System ComponentsArea (A): Mapping out the daily 'Box High' (Previous Day High) and 'Box Low' (Previous Day Low), alongside macro 'Swing High' and 'Swing Low' levels. Trading is strictly executed at outer boundaries (buy support, short resistance), avoiding low-probability middle ranges.Range (R): Measures the range of the daily box ($BoxHigh - BoxLow$). Signals require an unabated push of at least 20% of the box range before looking for entries. Targets are mathematically structured between 50% (mid-range) to 100% (opposite extreme) of the total range.Candle (C): Identifies institutional orderflow defense via rejection candle wicks (Hammers / Inverted Hammers, dubbed 'John Wicks') that touch boundary support/resistance zones, triggering on a subsequent candle high/low break.
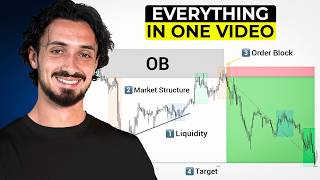
Strategy DescriptionThis institutional-grade strategy uses the footprints of smart money by combining Bearish Order Blocks with Fair Value Gaps (FVG) and structural liquidity pools. When institutional block orders clear, they create rapid price movement leaving behind unbalanced pricing structures (FVG) and structural zones (Order Blocks) where unexecuted/resting orders reside.Strategy Rules:Trend Filter: Price must remain below the 200-period Exponential Moving Average (EMA) to ensure alignment with bearish momentum.Order Block Selection: We locate a Bullish Candle immediately followed by an engulfing Bearish Candle that closes lower than the lowest wick of the Bullish Candle.Fair Value Gap (FVG) Confirmation: The gap is verified if there is zero intersection between the low of the first candle (the OB) and the high of the third candle.Entry Point: Position a sell limit entry at the High of the validated Order Block candle.Stop Loss Level: The Stop Loss is set safely above the entry at a distance equal to the height of the Order Block candle.Take Profit Target: Configured at a 1:2 risk-reward ratio or targeting the localized swing low.
 Neeraj joshi
Strategy OverviewThe 7PM Fair Value Gap (FVG) Trading Strategy leverages the high-volatility window around the US Stock Market opening bell (9:30 AM EST / 7:00 PM IST). High institutional order flow during this timeframe creates distinct price imbalance zones (Fair Value Gaps) on a 15-minute timeframe. The strategy seeks to capture retracements into these FVGs between 7:00 PM and 12:00 AM IST (or corresponding server hours).Core Rules & FiltersTime Window: 7:00 PM to 12:00 AM IST (Monday to Friday). Weekend trading is strictly excluded due to low market depth and false signals.Timeframe: 15-Minute Chart.Bullish FVG: Formed when the low of candle 3 is higher than the high of candle 1, created by a strong bullish momentum candle 2.Bearish FVG: Formed when the high of candle 3 is lower than the low of candle 1, created by a strong bearish momentum candle 2.Entry Criterion: Limit entry or immediate market execution as soon as price retraces back into the active FVG zone within the session hours.Risk Management: Stop loss placed at the opposite edge of the FVG structure or candle boundary. Take profit target fixed at 1:2 Risk-to-Reward ratio.
 The Rumers
Strategy OverviewThe Pattern Scalp is an opening range reversal strategy designed to take advantage of high volatility and institutional position manipulation during the first 1 hour of the trading session. Built around the 15-minute opening range and refined using a 5-minute execution chart, the strategy seeks to identify exhausted fast-moving candles, validating institutional traps, and reversing the direction for high-probability setups.Key Parameters & InputsATR Length: 14 days (applied on the Daily timeframe) to establish the standard expected range.ATR Multiplier: 20% threshold to validate if the opening 15-minute range is an abnormal "manipulation candle."Timeframes: 15-minute chart used to mark the opening range, 5-minute chart used for pattern execution.Strategy FiltersOpening Range Phase: Wait for the first 15-minute candle of the session to fully complete.Manipulation Test: Calculate the high-to-low height of the 15-minute opening range. If the size is > 20% of the Daily 14-period ATR, the market exhibits institutional manipulation, unlocking trade viability.Reversal Direction: If the opening 15-minute candle was bearish (closed lower than open), seek Bullish setups. If it was bullish (closed higher than open), seek Bearish setups.Entry RulesJohn Wick (Hammer / Inverted Hammer) Pattern: On the 5-minute execution chart, identify a Hammer candle (bullish setup) or Inverted Hammer (bearish setup). Enter immediate buy/sell positions upon breakout of the wick high/low.Power of Tower (Engulfing Reversal) Pattern: If an aggressive 5-minute counter-candle covers at least 50% of the previous manipulation-direction candle, enter instantly at the close of the pattern.Exit RulesTake Profit: Target the opposite boundary of the 15-minute opening range (High of the day for Longs, Low of the day for Shorts). If the trigger occurs near the range edge, apply a fallback risk-to-reward limit of 1.5x of your risk.Stop Loss: Placed directly below the wick of the Hammer (for Longs) or above the wick of the Shooting Star (for Shorts).
 The Rumers
Strategy OverviewThe Sneaky Pivot Reversal strategy is a clean, multi-day support and resistance breakout-reversal strategy executed on the 15-minute timeframe. It utilizes the previous day's high (Range High), previous day's low (Range Low), and historical lookback swing coordinates (Swing High/Low) to target high-probability execution setups.Key Strategy Rules15-Minute Candle 1 (Test Candle): Hits or penetrates inside a narrow band surrounding key daily boundaries (Range High/Low or Swing High/Low).15-Minute Candle 2 (Sneaky Candle): Confirms rejection by forming an opposite-colored candle that holds the established structural low or high.15-Minute Candle 3 (Execution Candle): Triggered when the current market price breaks above the high (for longs) or below the low (for shorts) of Candle 2.Risk ManagementStop-losses are structurally set below the lowest point of the setup candles (for longs) or above the highest point of the setup candles (for shorts). Profit targets are set directly at the opposite side of the range bounds.
 Trade with Pat
Strategy OverviewThis institutional liquidity sweep strategy captures market turnarounds that occur immediately after stop losses are triggered. Retail traders often set predictable stops just below key support or above key resistance lines. Institutional trading desks seek out these areas of clustered liquidity to fill large order sizes, producing fake outs or 'liquidity sweeps'. This system acts systematically by entering exact reversal directions immediately after a key level sweep has finalized and closed back inside range boundaries.Trading Rules and ProcessIdentify Reference Levels: Detect structural peaks and valleys over a user-defined lookback timeframe (e.g. 20 candles) to define core Support and Resistance lines.EMA Trend Verification: Only pursue market actions moving with the main trend. Ensure the current signal close is strictly above the 200 EMA for buy sweeps and below for sell sweeps.Entry Triggers:Long Trigger: The prior candle's low falls below Support, but closes back above Support while trading above the 200 EMA.Short Trigger: The prior candle's high rises above Resistance, but closes back below Resistance while trading below the 200 EMA.Exit Rules: Stop Loss is set at the extreme high/low point of the sweep wick with a tiny point cushion. The system targets a set Risk-to-Reward Ratio of 1:1.5.
 Trading With Sidhant
This simple day trading scalping strategy leverages institutional levels marked by the Previous Day High (PDH) and Previous Day Low (PDL) to capture rapid intraday expansion moves. Operating on a strict timeline restricted to the first 2.5 hours of the market session, it minimizes exposure during low-volume mid-day doldrums.Key Execution Criteria:Reference Period: Daily High and Daily Low are plotted on a 1D chart.Breakout Detection: Wait for a 15-minute candle to close above PDH or below PDL. This acts as the directional confirmation filter.Retest and Entry: Transition to a 5-minute chart to identify entry candles. Enter only when the price pulls back to retest the breakout line (PDH/PDL) using a clear Hammer / Shooting Star or a Bullish/Bearish Engulfing pattern.Timing Filter: All setups must construct and execute strictly within the first 150 minutes of trading (for Nifty, 09:15 to 11:45 IST).Trade Management: Implement a 1:3 target risk-to-reward ratio. Scale out 50% of trade volume at a 1:2 ratio, immediately adjusting stop loss to the absolute entry price (breakeven trailing).
 The Simplified Trader
M1 • XAUUSD • 2R Risk-to-RewardAsia Session Liquidity Sweep & CISD Gold Trading EAThis Expert Advisor is based on a trading concept focused on Asia session liquidity, liquidity sweeps, displacement and Change in State of Delivery (CISD). The strategy has been converted into a systematic trading algorithm designed primarily for the 1-minute timeframe and volatile instruments such as Gold (XAUUSD).How the Strategy WorksDuring the Asia session from 06:00 to 12:00, the EA records the absolute session High and Low. These levels are treated as potential liquidity pools for the later trading session.After 12:00, the EA waits for price to aggressively sweep either the Asia High or Asia Low. A liquidity sweep alone does not trigger a trade. The strategy then looks for strong displacement and a Change in State of Delivery (CISD) to confirm a potential shift in market direction.Once the displacement is confirmed, the EA calculates the 50% Fibonacci retracement from the origin of the displacement move to its extreme. This 50% Equilibrium level is used as the potential limit-entry price.Timeframe1-Minute (M1)InstrumentGold (XAUUSD)Entry50% Fibonacci EquilibriumTake ProfitFixed 2R TargetRisk ManagementStop LossPositioned beyond the relevant liquidity sweep extreme, with a small buffer for spread and slippage.Take ProfitFixed at a 2.0 Risk-to-Reward ratio based on the calculated trade risk.Trading WorkflowAsia Range → Liquidity Sweep → Displacement → CISD → 50% Equilibrium Entry → 2R TargetBacktest & PerformanceThe trading concept has been converted into an automated Expert Advisor and evaluated using historical market data. The backtest results shown below represent the performance generated under the selected testing conditions.Past performance and backtest results do not guarantee future results. Actual trading performance may vary due to spread, slippage, commissions, execution conditions and market changes.
 TradingLab
Multi-Timeframe · Price Action · Supply & Demand · Claim vs Reality Market Structure & Supply/Demand Strategy A price action strategy based on market structure, swing highs and lows, supply and demand zones, and multi-timeframe confirmation. The strategy is being tested to determine whether its claimed edge holds up against actual market results. The Claim The strategy claims that identifying the dominant market structure and waiting for price to revisit high-quality supply or demand zones can produce high-probability setups. Multi-timeframe confirmation and a minimum 2.5R target are used to filter potential trades. Strategy Rules 1. Market Structure Identify the prevailing trend using valid structural highs and lows. 2. Supply & Demand Mark relevant zones and wait for price to return rather than chasing the move. 3. Confirmation Use lower-timeframe price action to confirm the potential execution. 4. Risk / Reward Only consider setups offering a minimum 2.5:1 planned risk-to-reward ratio. Claim vs Reality This strategy is not being presented as a proven profitable system. The purpose of the test is to compare the strategy's theoretical claims with actual trading performance. Results can be evaluated using win rate, average R:R, drawdown, consecutive losses, expectancy, and the percentage of setups reaching their planned target. What We're Testing Market Structure Supply & Demand Multi-Timeframe Confirmation 2.5R Minimum Win Rate Drawdown Expectancy
 Neeraj joshi
Price Action • Market Structure • Human Testing • Claim vs Reality Master Price Action Trading Strategies A human-tested price action framework based on market structure, support and resistance, supply and demand zones, breakouts, breakdowns, and candlestick confirmation. The objective is to compare the strategy's educational claims with actual market behavior. Strategy Overview The strategy focuses on reading price rather than relying on traditional technical indicators. The market is first classified as an uptrend, downtrend, or sideways market before important support, resistance, supply, and demand areas are identified. Price is then monitored as it approaches these areas. A trade is considered only when price action provides a potential confirmation, such as a rejection wick, strong impulsive candle, breakout, or breakdown. Core Price Action Concepts Market Structure Higher highs and higher lows indicate an uptrend, while lower highs and lower lows indicate a downtrend. Support & Resistance Previous reaction areas are marked as potential levels where price may reject or break through. Supply & Demand Areas showing significant buying or selling pressure are monitored for potential reactions. Breakouts & Breakdowns Price breaking established levels is evaluated for continuation or potential false-breakout behavior. Human Testing — Not Fully Automated This strategy is currently being tested through human analysis and manual execution. It is not a completely automated Expert Advisor. Some parts of the strategy can potentially be converted into mechanical rules, but identifying meaningful market structure, selecting quality levels, and interpreting candlestick confirmation still involve human judgment during this testing phase. Testing Process 01 Identify Market Structure Determine whether buyers, sellers, or neither side currently appears to have control. 02 Mark Key Levels Identify relevant support, resistance, supply, and demand areas. 03 Wait for Price Action Allow price to reach the level instead of entering simply because the level exists. 04 Human Confirmation Evaluate rejection candles, momentum candles, breakouts, or breakdowns before considering entry. Claim vs Reality The purpose of this test is not to assume that price action automatically provides a trading edge. The strategy is being evaluated against actual market conditions to determine whether the concepts described in the educational material produce repeatable results. Win Rate Risk / Reward Drawdown Trade Frequency Consistency Testing Note: This is an experimental human-assisted strategy test. The strategy is not currently a fully automated trading system, and testing results do not guarantee future performance. Forex and leveraged markets involve significant risk.
 Data Trader
M5 Scalping • 4H Range Breakout • Human TestingThe 4-Hour Range Scalping StrategyA human-tested intraday scalping framework based on the high and low of the first 4-hour candle of the New York trading day. The 5-minute chart is used to monitor range breaks and re-entry behavior, with potential trades evaluated against a predefined 2:1 Risk-to-Reward target.Strategy OverviewThe strategy establishes a defined trading range using the high and low of the first 4-hour candle of the New York session. Once the range is established, price is monitored on the 5-minute timeframe for a potential breakout followed by a re-entry into the range.The breakout and re-entry behavior is treated as the primary setup condition. A potential trade is then evaluated using the predefined entry, stop-loss, and 2:1 Risk-to-Reward framework.Core Strategy Framework01. Define the 4H RangeRecord the high and low of the first 4-hour candle of the New York trading day.02. Monitor the M5 ChartWait for price to interact with and potentially break one side of the established range.03. Break & Re-EntryEvaluate whether price breaks the range and then returns back inside it before considering an entry.04. 2:1 Risk-to-RewardPotential setups are evaluated using a predefined 2:1 Risk-to-Reward objective.Human Testing — Not Fully AutomatedAlthough the strategy is described as mechanical, it is currently being tested through human analysis and manual execution. It is not yet a completely automated Expert Advisor.The testing process evaluates how consistently the range, breakout, re-entry, and risk-to-reward rules can be identified and applied across different market conditions.Claim vs RealityThe strategy claims that the first 4-hour New York range can provide a simple framework for identifying short-term breakout and re-entry opportunities on the 5-minute chart. This test evaluates whether that concept produces repeatable results rather than assuming the setup is profitable.The results are assessed using actual trade outcomes, win rate, 2R target achievement, losing streaks, drawdown, and consistency across different market conditions.What We Are Testing4H Range High / LowNew York SessionM5 BreakoutRange Re-Entry2:1 Risk-to-RewardWin RateDrawdownConsistencyTesting ObjectiveThe objective is to apply the 4-hour range rules consistently, record both successful and failed break-and-re-entry setups, and determine whether the claimed 2:1 Risk-to-Reward approach produces a measurable edge over a meaningful sample of trades.Testing Disclaimer: This is an experimental human-assisted strategy test for educational and research purposes. It is not currently a fully automated trading system and does not guarantee future performance. Trading leveraged financial instruments involves significant risk.
 TJR
TJR
Index Futures • Liquidity • 5M/1M Confirmation • Human Testing TJR UPDATED Day Trading Strategy (2026) A human-tested day trading framework based on higher-timeframe liquidity, session high and low manipulation, 5-minute market structure confirmation, and 1-minute execution. The strategy is being tested to determine whether its liquidity-based concepts produce repeatable results in actual market conditions. Strategy Overview The strategy uses a top-down approach to identify where price may be drawn toward higher-timeframe liquidity. Session highs and lows are monitored for potential liquidity manipulation before looking for a structural shift and trade opportunity. The 5-minute timeframe is used to evaluate market structure and potential Break of Structure (BOS), while the 1-minute timeframe is used to refine the potential entry. Market correlation and broader context are also considered before a trade is taken. Core Strategy Framework 01. Higher-Timeframe Liquidity Identify important liquidity areas and determine where price may potentially be attracted. 02. Session Manipulation Monitor previous or current session highs and lows for potential liquidity sweeps and manipulation. 03. 5M Structure Confirmation Look for a meaningful structural shift or Break of Structure before considering an execution. 04. 1M Execution Use the 1-minute timeframe to refine the entry after the higher-timeframe conditions are satisfied. Human Testing — Not Fully Automated This strategy is currently being evaluated through human analysis and manual decision-making. It is not a completely automated trading system. Concepts such as liquidity manipulation, meaningful market structure, valid Break of Structure, and correlation require contextual interpretation and cannot currently be treated as simple binary rules in every market condition. Claim vs Reality The strategy presents a structured method for identifying liquidity-driven opportunities around important session levels. This test is designed to determine whether those concepts actually provide a measurable trading advantage rather than assuming the strategy works because the framework appears logical on historical charts. Trades are evaluated based on the defined setup conditions, execution quality, target achievement, losses, drawdown, and consistency across different market environments. What We Are Testing Higher-Timeframe Liquidity Session High / Low Sweeps Break of Structure 5M Confirmation 1M Execution Market Correlation Win Rate Drawdown Testing Objective The objective is to apply the strategy as consistently as possible, record the actual outcomes, and compare the original claims with measurable trading results. The final assessment should be based on collected data rather than selected winning examples. Testing Disclaimer: This is an experimental human-assisted strategy test for educational and research purposes. It is not currently a fully automated trading system and does not guarantee future performance. Trading leveraged financial instruments involves significant risk.
 The Simplified Trader
1H Context • 1M Execution • 10:00 AM EST • Human TestingThe 1H Candle Pattern (1H to 1M Strategy)A human-tested intraday trading framework built around the 10:00 AM EST 1-hour candle. The candle is used to establish higher-timeframe market context, while potential entries are evaluated exclusively between 11:00 AM and 12:00 PM EST on the 1-minute chart using a Change in State of Delivery (CISD) trigger.Strategy OverviewThe strategy uses a specific 1-hour candle as the primary reference point. After the 10:00 AM EST candle establishes its range and market context, price behavior is monitored during the following execution window. The 1-minute timeframe is then used to identify potential entry opportunities around the predefined conditions.The CISD trigger is used as the lower-timeframe confirmation rather than entering simply because price reaches a particular level. This creates a structured process for testing whether the higher-timeframe candle context can improve short-term trade selection.Core Strategy Framework01. 10:00 AM EST CandleUse the designated 1-hour candle to establish the primary market context and identify its relevant price range.02. Higher-Timeframe ContextEvaluate how price interacts with the 1-hour candle and whether the surrounding market structure supports the setup.03. 1-Minute ExecutionMonitor the 1-minute chart only during the defined execution period for a valid setup.04. CISD ConfirmationUse a Change in State of Delivery trigger as the confirmation before considering a potential entry.Human Testing — Not Fully AutomatedThis strategy is currently being tested through human analysis and manual decision-making. It is not a completely automated Expert Advisor.The interpretation of the 1-hour context, price interaction, market conditions, and CISD confirmation can require judgment. The purpose of testing is to determine which parts of the strategy can be defined consistently and potentially converted into mechanical rules.Claim vs RealityThe strategy claims that a specific 1-hour candle can provide useful market context for short-term trading and that a lower-timeframe CISD trigger can help identify precise entries. This test evaluates those claims against actual market behavior rather than assuming the pattern provides an edge.Performance is evaluated using actual trade outcomes, entry quality, target achievement, losses, drawdown, consistency, and the behavior of the setup across different market conditions.What We Are Testing10:00 AM EST Candle1H Context1M ExecutionCISD Trigger11 AM–12 PM WindowWin RateDrawdownConsistencyTesting ObjectiveThe objective is to apply the strategy consistently during its defined time window, record both winning and losing setups, and determine whether the 1H-to-1M framework and CISD trigger produce a measurable edge.Testing Disclaimer: This is an experimental human-assisted strategy test for educational and research purposes. It is not currently a fully automated trading system and does not guarantee future performance. Trading leveraged financial instruments involves significant risk.
 PB Trading
A human-tested scalping framework focused on the 9:30 AM EST market open and potential liquidity sweeps. The strategy examines pre-market accumulation, opening-session manipulation into key price levels, and 1-minute displacement or inversion signals as confirmation for potential entries. It is being tested against actual market conditions to determine whether the claimed high-win-rate setup produces consistent results, rather than assuming the concept is profitable.This is currently a human-assisted strategy test, not a completely automated trading system. Identifying meaningful liquidity levels, interpreting opening manipulation, and validating displacement or inversion can require contextual judgment.
 The Trading Geek
XAUUSD • Gold Scalping • 1H/15M • Human Testing BEST Gold Scalping Strategy (Beginner to PRO) A human-tested Gold (XAUUSD) scalping framework based on 1-hour and 15-minute trend alignment, supply and demand zones, liquidity sweeps, and structured trade entries. The strategy is being tested to determine whether the concepts presented in the original educational material produce consistent results under real market conditions. Strategy Overview The strategy focuses specifically on XAUUSD and uses a top-down approach to identify potential scalping opportunities. The 1-hour timeframe is used to understand the broader market direction, while the 15-minute timeframe is used to refine the setup and identify potential areas of interest. Potential trades are considered around supply and demand points of interest after price interacts with liquidity areas. A liquidity sweep or other price-action confirmation is then evaluated before a manual trade decision is made. Claim vs Reality The original strategy presents a structured approach for scalping Gold using timeframe alignment, supply and demand, liquidity sweeps, and fast trade execution. Rather than assuming these concepts guarantee profitable results, we are testing the claims against actual market behavior. The testing focuses on whether the setup can produce repeatable opportunities and how it performs across different market conditions, including trending markets, ranging conditions, volatile sessions, and failed setups. Human Testing — Not Fully Automated This is currently a human-assisted trading strategy test and is not a completely automated Expert Advisor. While some rules can be defined mechanically, identifying high-quality supply and demand areas, interpreting liquidity sweeps, and judging market context can still require human discretion. What We Are Testing 1-hour and 15-minute trend alignment Quality of XAUUSD supply and demand zones Liquidity sweep confirmations Entry timing and trade execution Target achievement and stop-loss behavior Win rate, drawdown, and consistency Performance across different Gold market conditions Testing Objective The objective is simple: test the strategy as it is taught, document the trades honestly, and compare the expected results with what actually happens in the market. The final evaluation should be based on collected trading data rather than the strategy's marketing claims. Testing Disclaimer: This strategy is being tested for educational and research purposes. It is not a guarantee of profitability and is not currently a fully automated trading system. Trading XAUUSD and other leveraged financial instruments involves significant risk.
 Stock Learners
Gold • Daily Range Liquidity • 1-Minute ScalpingBest Trading Strategy For Beginners - Scalping StrategyA high risk-to-reward scalping framework using previous-day high and low boundaries as institutional liquidity pools. Trades are triggered on the 1-minute chart after price breaches daily extremes and shows immediate candle confirmation.
 Lewis Kelly
Smart Money Concepts • Swing Structure • Session Liquidity • Human Testing Full Smart Money Concepts Strategy A human-tested Smart Money Concepts (SMC) framework based on macro market structure, session liquidity sweeps, Change of Character (CHoCH), Order Blocks, and Previous Day Highs and Lows. The strategy is being tested to determine whether these concepts provide a repeatable edge in actual market conditions. Strategy Overview The framework starts with the higher-timeframe market structure to establish the broader directional context. Swing highs and lows are analyzed to understand whether the market is generally bullish, bearish, or transitioning between conditions. Session liquidity is then monitored around important Asia and London highs and lows. A potential liquidity sweep is used as a point of interest before moving to lower timeframes for confirmation and possible execution. Core SMC Framework 01. Macro Swing Structure Identify significant swing highs and lows to establish the broader market direction and structural context. 02. Session Liquidity Monitor Asia and London session highs and lows for potential liquidity sweeps and stop runs. 03. CHoCH Confirmation Look for a Change of Character on a lower timeframe before considering a potential reversal or continuation. 04. Order Block Entry Evaluate relevant Order Blocks after confirmation and use them as potential areas for execution. Liquidity-Based Targets Previous Day High (PDH) and Previous Day Low (PDL) are treated as important reference points and potential liquidity targets. The test evaluates whether these levels provide useful objectives when combined with the broader SMC framework. Previous Day High Previous Day Low Asia High / Low London High / Low Human Testing — Not Fully Automated This strategy is currently being tested through human analysis and manual decision-making. It is not a completely automated Expert Advisor. Concepts such as meaningful swing structure, liquidity sweeps, valid CHoCH formations, and high-quality Order Blocks can involve contextual judgment. The purpose of this testing phase is to determine which parts of the framework can eventually be converted into consistent, measurable rules. Claim vs Reality Smart Money Concepts often claim that institutional liquidity, market structure, Order Blocks, and session manipulation can help traders identify high-probability opportunities. This test does not assume those claims are automatically true. The framework is being applied to actual market conditions to evaluate whether liquidity sweeps followed by structural confirmation and Order Block entries produce repeatable results. What We Are Testing Macro Structure Liquidity Sweeps CHoCH Order Blocks PDH / PDL Session Liquidity Win Rate Drawdown Testing Objective The objective is to apply the SMC framework consistently, document both successful and failed setups, and compare the strategy's theoretical claims with measurable trading results. The final assessment should be based on the complete testing sample rather than selected winning examples. Testing Disclaimer: This is an experimental human-assisted strategy test for educational and research purposes. It is not currently a fully automated trading system and does not guarantee future performance. Trading leveraged financial instruments involves significant risk.
Results vary widely by strategy. Across the strategies we've tested, average claimed win rates run higher than what we actually measure in backtests — check each individual strategy page for the exact claimed-vs-actual figures.
We extract the entry, exit, timeframe, and risk rules described in the original video, code them into an MT5 Expert Advisor (or Pine Script), and run historical backtests using consistent, defined parameters.
Often not. Creators can cherry-pick timeframes or omit losing periods. Our comparison tables show the creator's claimed win rate alongside our own tested result for each strategy so you can judge the gap yourself.
Yes. Selected original EAs are available for free download so you can run your own tests before deciding whether an optimized version is worth exploring.
Yes. We always code and backtest the strategy exactly as the creator describes it first. Only after that baseline is established do we build an optimized version.
The original EA follows the creator's rules as described, with no changes. The optimized EA is our refined version, built after testing, with adjusted risk management, entries, or exits aimed at improving real-world performance.
Most strategies are coded as MT5 Expert Advisors, and select strategies also include a Pine Script version for TradingView. Each strategy page notes which formats are available.
No. Backtested results are historical and do not guarantee future performance. Outcomes can vary depending on your broker, spread, execution speed, and current market conditions.
Trading financial instruments, including forex, futures, and automated Expert Advisors (EAs), carries a high level of risk and may not be suitable for all investors. Backtested historical results are simulated and do not guarantee future performance. Market conditions change, and past consistency is not indicative of future profitability. Always conduct your own research, use proper risk management, and test any strategies on demo accounts before trading with real capital.
Download the complete quantitative guide: Position Sizing Formulas, Prop Firm Drawdown Rules, and MQL5 Parameter Cheat Sheets.