


Master Trader Due Diligence: 6 Critical Metrics to Audit Before Mirroring Capital
Published: Oct 17, 2026 Last Updated: Oct 17, 2026 By FXSnipers Team ✓ Reviewed by FXSnipers Research Team
Setup Blueprint

Master Trader Due Diligence: 6 Critical Metrics to Audit Before Mirroring Capital

Surface-level ROI hides lethal risk profiles like martingale grids and toxic exposure. Learn the 6 quantitative metrics required to audit master traders before committing follower capital.

Introduction

The retail copy trading space is riddled with optical illusions. High-ranking leaderboards regularly spotlight master accounts flaunting +400% annualized gains, clean upward-trending equity curves, and pristine 92% win rates. Yet beneath this polished veneer often lies an explosive ticking time bomb: unhedged martingale grids, toxic floating drawdowns masked by unrealized losses, and aggressive leverage spikes that inevitably wipe out follower accounts during unexpected market expansions.

Passive investors often mistake cumulative return for algorithmic edge. In reality, evaluating a signal provider requires the exact same quantitative scrutiny institutional allocators apply to quantitative hedge funds. Before delegating a single dollar through broker synchronization bridges or your WeTrade copier dashboard, you must bypass headline profits and audit the underlying microstructure of the master trader's execution architecture.

Due Diligence Rule Zero: Return without risk context is statistical noise. A 30% annualized gain with a 4% maximum historical drawdown is exponentially superior to a 300% annualized gain backed by a 65% floating drawdown duration.

1. Drawdown Duration & Underwater Equity

Most retail followers check only one drawdown metric: peak-to-trough balance drawdown percentage. Signal providers exploit this flaw by leaving losing positions open perpetually. Because balance only updates upon position closure, an equity curve can suffer catastrophic degradation while the closed-trade balance appears immaculately linear.

To uncover the truth, you must evaluate Drawdown Duration (Underwater Time) alongside the Ulcer Index. Drawdown duration tracks the exact elapsed time between when an account hits a high-water mark, enters an equity valley, and successfully achieves a new peak.

'If an account spends 70% of its trading lifecycle underwater with floating negative equity, it is not generating alpha; it is merely holding its breath until the market reverses.'

When inspecting candidate accounts on the live trading performance leaderboard, calculate the Recovery Factor (Net Absolute Profit divided by Maximum Drawdown) and cross-reference it with the maximum recovery time. A master trader who takes 140 days to claw back out of an 18% drawdown possesses poor capital recovery efficiency and creates structural drag on portfolio liquidity.

2. Max Open Lot & Position Stacking Factor

A pervasive risk in automated mirroring systems is position stacking. A master trader may claim to risk only 0.5% per trade with an initial base lot of 0.10. However, during an adverse price excursion, their algorithm may initiate a cost-averaging sequence: opening 0.10, then 0.20, then 0.40, then 0.80 lots as the market moves further out of alignment.

This parameter is measured via the Maximum Open Lot Multiplier. You must analyze the ratio between the master's baseline opening trade size and their historical peak aggregate volume across open exposure:

Linear Fixed Lot Profile: Max open exposure never exceeds 2.5x the base lot size across correlated currency pairs. Demonstrates programmatic discipline.
Martingale/Grid Multiplier: Cumulative open volume reaches 8x to 32x the initial entry size. Guaranteed account liquidation under systemic trend events.

When auditing historical trade tickets, filter by highest aggregate volume open simultaneously. If you observe 12 simultaneous EUR/USD buy orders executed across a 90-pip descent, that provider is operating an unhedged grid regardless of how they label their strategy marketing.

3. Trade Frequency vs. Execution Drag

Trade frequency reveals both algorithmic integrity and alignment of incentives. Some signal masters deliberately inflate trading frequency—executing 80 to 200 micro-scalps per day with average profit targets of 1.2 to 2.5 pips. While this creates a rapid-fire trade history, it introduces lethal friction for follower terminals.

  • Slippage Sensitivity: Scalping systems harvesting 2 pips net cannot survive 0.8 pips of inter-broker copy latency. The master records a win; the follower takes a loss.
  • Rebate Churning: If the signal master earns affiliate commissions based on mirrored trading turnover, ultra-high frequency setups exist to harvest lot-volume rebates rather than generate genuine alpha.
  • Network Congestion: Excessive orders increase network bridge queue times, leading to rejected limits or requotes during London-New York overlaps.

Verify that the candidate master exhibits a healthy Average Trade Duration (ATD). Swing and intra-day session systems with holding periods between 45 minutes and 18 hours routinely outperform micro-scalpers over multi-year cycles when executed across diverse follower brokerages.

4. Margin Level Floor & Mathematical Expectancy

The remaining three critical criteria in your audit checklist focus on capital sustainability: the Margin Level Minimum, the Historical Win/Loss Payoff Ratio, and the Correlation Coefficient across instruments.

The Mathematical Expectancy Equation for Copy Audits:

Expectancy = (Win Rate % * Average Win in Pips) - (Loss Rate % * Average Loss in Pips). An account with a 90% win rate where Average Win is $12 and Average Loss is $180 has a negative mathematical expectancy of -$7.20 per trade. It is structurally doomed.

Inspect the historical Margin Level % telemetry. Professional algorithmic portfolios documented on our copy trading master directories never allow open margin levels to dip below 800%. If a signal provider dips to 180% or 120% margin usage during adverse trends, a sudden margin-rate hike from liquidity providers or a weekend gap will trigger a catastrophic margin stop-out.

Configuring Follower-Side Safety Architecture

Even after qualifying a verified master through rigid quantitative metrics, your defensive responsibilities as a copier are not complete. Never permit unconstrained, direct proportional replication without client-side risk containment rules embedded into your local terminal.

Terminal Hard Equity Stops: Configure a hard disconnection rule: if absolute account equity drops by 12% from the weekly high-water mark, automatically liquidate all open copied tickets and sever API mirroring immediately.
Per-Symbol Lot Capping: Hard-cap individual trade volume to a strict upper limit (e.g., maximum 0.50 lots per ticket) to insulate your balance if the master executes an uncontrolled martingale sequence.

By pairing pre-connection metric audits with independent follower-side execution safeguards, you insulate your capital from emotional breakdowns, algorithm failure modes, and catastrophic rogue-trading events.

Frequently Asked Questions

Below are direct answers to the most frequently asked questions about this strategy, risk parameters, and automated execution.

1. What is an acceptable maximum drawdown duration for a swing master trader?

For intra-day and swing trading strategies, an acceptable drawdown duration should not exceed 30 to 45 trading days to recover to a new high-water mark. Any strategy spending more than 90 consecutive days in floating or realized drawdown demonstrates poor expectancy or regime mismatch, indicating that the core algorithm is failing to adapt to prevailing volatility cycles.

2. How do I detect a hidden martingale algorithm if the provider hides closed trade details?

Analyze the divergence between the Balance curve and the Equity curve. In a hidden martingale or unhedged grid, the Balance curve climbs in a perfectly smooth, straight line, while the Equity curve shows steep, sharp downward spikes that periodically dip deeply below the balance line. Furthermore, check the margin usage telemetry: recurring spikes in used margin confirm aggressive lot multiplier scaling.

3. What is the minimum live track record length required to conduct valid due diligence?

A minimum of 6 to 9 months of verified live execution history (representing at least 300 to 500 completed trades) is required. Backtests or track records under 90 days lack statistical significance and fail to capture multiple market regimes such as monetary policy shifts, consolidation phases, and high-volatility flash events.

4. How does execution slippage differ between the master account and my follower account?

Slippage stems from two primary vectors: latency between server clusters (typically 20ms to 250ms) and spread differentials across different broker liquidity pools. If a master trades on a raw zero-spread account and the follower uses a standard account with an embedded markup of 1.2 pips, the follower will incur severe frictional loss that can transform a winning system into a losing account.

5. Should I copy a master trader using fixed-lot copying or proportional equity copying?

Proportional equity copying (or balance-ratio scaling) is strongly recommended over fixed-lot mirroring. If the master trader deposits or withdraws capital, proportional copying automatically recalibrates your sizing to mirror their precise percentage risk per trade. Fixed lots can easily lead to catastrophic over-leveraging if your account balance is significantly smaller than the master's baseline.

Final Thoughts

Master trader due diligence is not a one-time onboarding checkpoint; it is an active risk mitigation discipline. By continuously benchmarking candidate strategies across underwater drawdown durations, maximum lot expansion, trading frequency, and margin usage, you insulate yourself from deceptive marketing and structural portfolio blowups.

Treat your capital like an institutional fund allocator. Audit the metrics, implement independent circuit-breaker stop limits, and maintain ongoing performance telemetry to ensure consistent long-term portfolio growth.

RN

FXSnipers Team

Lead MQL Developer

Algorithmic systems architect and quantitative developer at FXSnipers. Specializes in MQL5 strategy automation, MT5 tick data modeling, and mathematical risk management systems.

Recommended Trading Tools & EAs

Automate your strategies with these fully backtested expert advisors matching this article's topics.

THRONE OF THORNS EA (CON)
Expert Advisor

THRONE OF THORNS EA (CON)

An adaptive auction-driven EA that reads live tick order flow to classify the market as TRENDING or RANGING, then deploys three coordinated roles — SWORD, SPIKE, and GHOST — to attack, recover, and extend positions with full daily profit-lock and drawdown protection.

GUNX & ROSES EA
Expert Advisor

GUNX & ROSES EA

An institutional-grade breakout and burst recovery engine powered by bio-inspired Dendritic Cell immune filtering, Dandelion Optimization, and multi-model probability fusion.

ALGO GURU EA
Expert Advisor

ALGO GURU EA

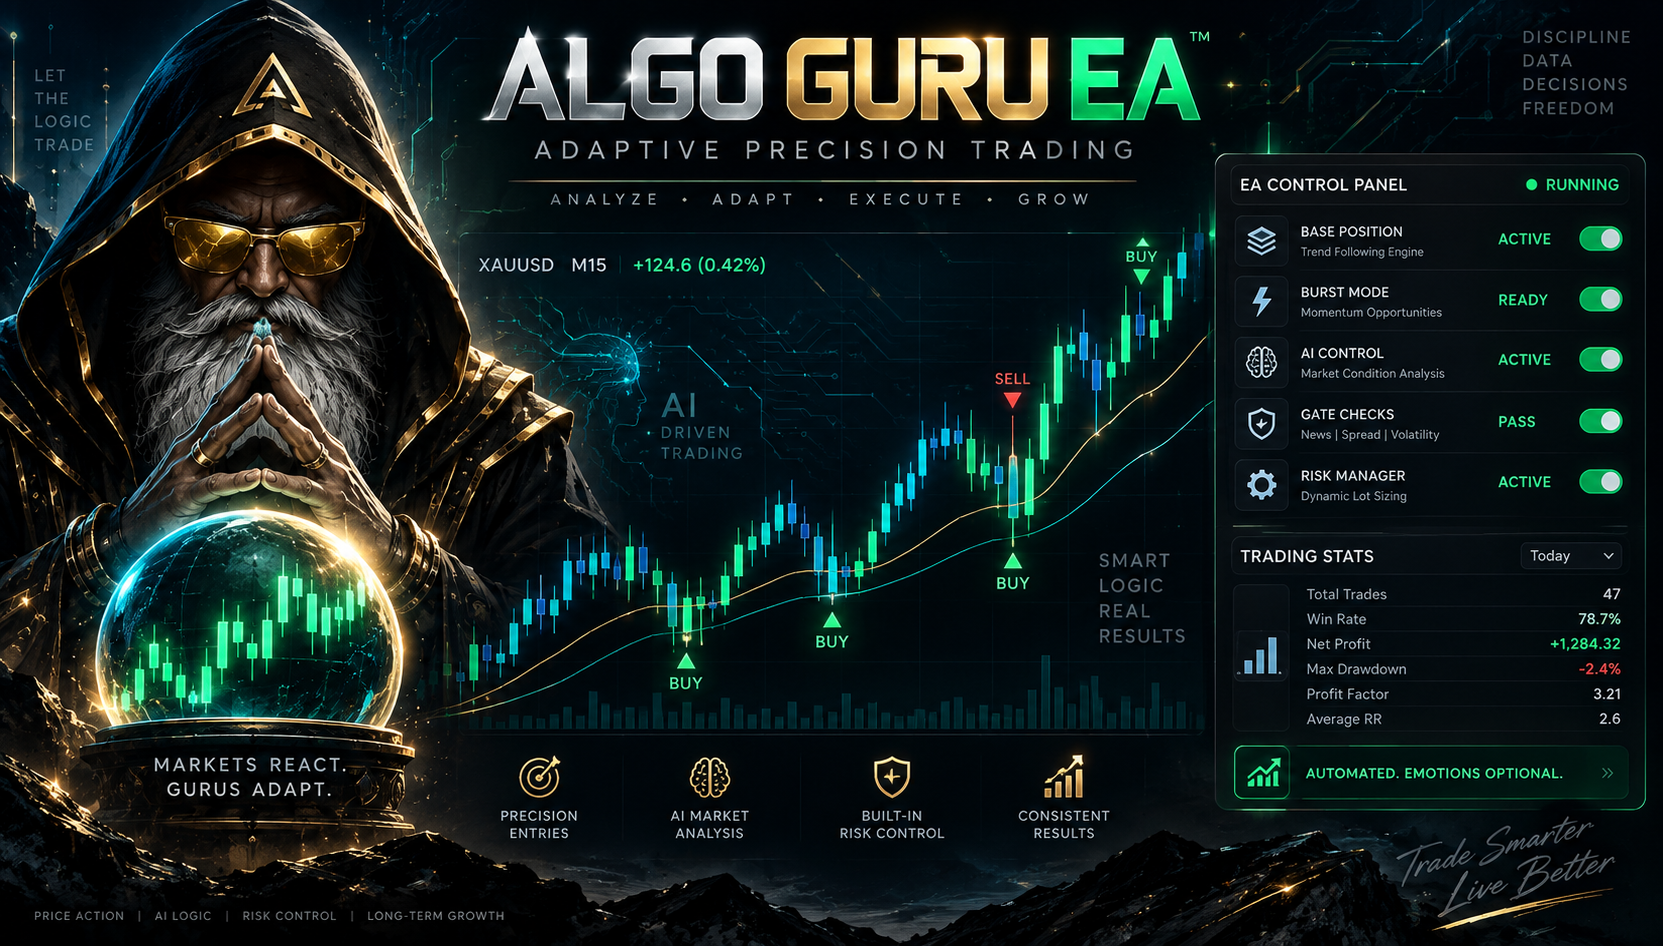
An institutional-grade algorithmic trading system for MetaTrader 5, combining a continuous Live Pressure Base engine with a high-frequency Burst recovery system, validated by the adaptive 'House of Honour' AI probability engine.

FXSnipers Team

Written by FXSnipers Team

The FXSnipers Team is a dedicated group of professional traders and quantitative developers. With years of experience building high-performance Expert Advisors, automated systems, and robust risk management strategies for MT4 and MT5, they share deep market insights to help retail traders automate their success.

Other Articles You Might Like

Exclusive Trader Kit 2026

Forex EA & Risk Management Cheat Sheet

Download the complete quantitative guide: Position Sizing Formulas, Prop Firm Drawdown Rules, and MQL5 Parameter Cheat Sheets.

Instant PDF Access No Spam Guarantee